
The Three Main Problems with Basketball Analytics
Analytics became a flashpoint in the wake of the Jaylen Brown trade, which I found amusing. Much of the discussion was note for note the debate that existed in baseball's discourse back when I was first starting to write about baseball. Back then, in 2003 and 2004, it was not at all nice, as old-school baseball scouts tried to belittle analytics as ridiculous, overplaying their hand to the degree that the old school was nearly wiped from the sport, which was unfortunate. Both sides hold value, but as the old guard got defensive about their suboptimal assimilation and quantification of their data, not to mention its inherently subjective nature (baseball scouts have undoubtedly collected tons of data for time eternal) they began to lose ground.
There is a gigantic difference between baseball and basketball statistics, however, and it makes the notion of basketball analytics a much trickier proposition.
Problem One: Discreet Events
The main advantage that baseball has over every other team sport is that 95-99% of the action in a baseball game is not really team-based at all. It's the pitcher and the hitter playing one-on-one, featuring influence from the catcher. These are discreet, measurable events that occur in most cases (a runner on base can be an exception, as can a fielders' position on the field in extreme cases) without any influence from anyone else. That makes the actions of the pitcher and hitter extremely measurable and extremely reliable historically. The batter-pitcher interactions in 2026 are remarkably similar if not identical to the batter-pitcher interactions of 1986. The same thoughts are going to occur to both parties in trying to suss out the optimal strategy on a 2-1 count today that occurred to them back then.
The same is not true for basketball. For one thing, the game is played completely differently today than it was in 1986, making historical comparisons much, much harder. But also, very few plays in a basketball game occur in a vacuum. Essentially, just free throws. And you don't need to do a ton to analyze free throws. Either you make them or you don't.
Take, for example, shot quality. In a 2026 article for The Athletic/The New York Times, renowned basketball quant and author Seth Partnow broke down the factors that go into the stat qSQ, or Quantified Shot Quality:
- Shot location & distance
- Pre-shot movement of the shooter (ie, catch-and-shoot, or dribbling)
- Position of shooter
- Closing speed and angles of approach of contesting defenders
- Dribbles taken
- Was a foul called?
- The value for for a what a hypothetical "average NBA player" would shoot on the same shot
That's a lot of factors. And there is a lot of room for subjectivity in even the tabulation of some of those factors. Even "was a foul called?" can be separated into two buckets, because sometimes a player will shoot but will not be granted continuation on the foul, and the shot is wiped away like it never happened. Some of the subjectivity can of course be sanded down with tracking cameras and math, but then we could also question the merits of some of those inputs, and how much each input should weigh in the calculation.
That is but one statistic, obviously, and other statistics are easier to calculate and/or understand. The formula for True Shooting Percentage is simply Points / (2 * (FGA + 0.44 * FTA)). I can not only find all of that information in today's box scores, but I could also find all of that information in box scores from the 1950's.
Problem Two: The Public Discourse Came Too Late
This, to me, is just a big of a deal. Baseball analytics had the luxury of being largely developed in the public eye. From Bill James and Pete Palmer, to Tom Tango and Mitchel Lichtman, to Baseball Prospectus, FanGraphs, The Hardball Times, and many, many others, there was a solid 30+ years where advanced baseball statistics were debated in the public square of both the internet and beyond. Those creating those statistics challenged each other, collaborated with each other, and learned from one another.
Then, in the 2000's and especially by the early 2010's, teams started picking off analysts one by one, and hiring them internally, and serving them with gag orders. Some analysts would also serve as consultants for certain teams, and while they wouldn't necessarily stop pushing out innovations for public consumption, human nature says now you're a little distracted, or perhaps you're going to save your best stuff for the party that is paying you more handsomely. In either case, the public square began emptying out.
Around the time when I was becoming a full-time employee at FanGraphs back in 2013, we were searching for new blog ideas. We had the main FanGraphs blog, plus the fantasy baseball RotoGraphs, and the whimsical NotGraphs (RIP). But we were on the hunt for more. We looked into a news-based site, but couldn't make the numbers work. We did launch TechGraphs, though we couldn't quite find enough of an audience. As we were debating these things, I asked about other sports, specifically basketball. Football had Football Outsiders, and some of their stats are now part of the broader public lexicon, but there didn't seem to be enough meat on the bone to do basketball. BP had tried Basketball Prospectus, and it never really took. It lasted roughly from 2007 to 2013, and much of its content centered around college basketball.
One of the main issues, I think, for this, is because basketball analytics didn't really get going until the stage where baseball's debate had long ended, and baseball teams had started hiring quants, and not only incorporated them into front offices, but in many cases ran them. Basketball teams saw this and followed suit just as basketball analytics were coming into vogue, so basketball analytics didn't get those 30+ years to hash out in public what the best metrics were or are. For instance, one of the transformative books on basketball analytics was Basketball on Paper by Dean Oliver, which first debuted in 2003. By that point, Bill James had published 28 books, including all of the editions of both his Bill James Baseball Abstract and Bill James Historical Baseball Abstract. By 2003, the Baseball Prospectus Annual had been published in eight different years. And if you asked Joe Sheehan or Christina Kahrl or one of BP's other founders, they will tell you they honed the stats they used when they founded BP in 1996 in part from the fervent discussions they had on Usenet message boards in the early 90s, when the internet was just a whisper.
A year later, per Wikipedia, Oliver was hired by the Sacramento Kings. He had set out to create a statistical analyst position in NBA front offices after Moneyball was published in 2003. Moneyball is of course the inside story of the Oakland A's and how they had already revolutionized baseball through analytics, and it shows how other teams, notably the Boston Red Sox, had already begun to do so as well. Basketball walked in baseball's footsteps.
As a result of basketball analytics coming of age in a time when teams were more willing to take analytics seriously, we have no idea how many of the prominent stats are calculated. In Partnow's 2026 article, he freely admits that he can't pin down for readers exactly how to calculate qSQ because the formula is propietary. He elaborated that "while I can't report this as a certainty since the algorithms used in qSQ are a closely held secret, I'm reasonably certain there are multiple models at work, given that the factors affecting a jump shot are different than a shot around the rim." This stat, qSQ, is calculated by Second Spectrum, which is a completely private website. When you go to their website, you are presented nothing but a log-in page:

In talking to media members familiar with the cost, it is said to be so high so as to completely inaccessible for lay or casual fans. Other sites, like Cleaning the Glass and Dunks and Threes let you access some stats for free, and also have subscriptions at price points that are reasonable for the lay fan. And of course, you can get all manner of advanced stats for free on NBA.com and Basketball-Reference.com. But unlike baseball, where it took a long, long time for the industry to coalesce around WAR (wins above replacement) as a catch-all metric, there is not one consensus catch-all metric (or even a small suite of them) for the basketball industry. This is partly why Zach Lowe jokingly says "Vorps and Schnorps," when referring to analytics, because there isn't one definitive stat that is considered the standard. To me, that is partially because it's harder to measure basketball analytically, but also because basketball analysts didn't have as long to argue the merits of their stats in the public square of the internet.
Problem Three: Lack of Context
As we covered in Problem One, you can in fact measure a lot of discreet things about any individual shot. But you can't really measure who is willing to take specific shots. For instance, say you're up two points with a minute left in Game 3 of the NBA Finals. The other team has walked down the 15-point lead you had at the start of the quarter, and you're reasonably sure/very fearful that if you don't get a bucket on this possession, the other team is going to tie it or take the lead, and the 3-0 series lead that seemed all but assured up until a couple of minutes ago might suddenly be a 2-1 lead. And Game 4 is also on the road. In that situation, is everyone on your team willing to take the big shot? What if it ends up being a tough shot, like this one?
Not all of the players would be, I assure you. But you can't measure that with a statistic.
A more regular example that we hear a lot about are on/off statistics. How well a team does with a player on the court vs. how well they do when the player is off the court. What is usually left out of that conversation is that if your team is well-coached, they may try to account for this. Such a team may in fact try to rest some of its starters when its star is on the court, pairing said star with less-seasoned bench players, trusting that their star will carry the lineups. And then when the star rests, they may choose to load three or four of the other starters back onto the court to keep the team going strong without its star. And if your team is really well coached and disciplined in its strategy, said strategy may affect the on/off stats of said star. Because the on/off stats of said star are completely irrelevant. What is relevant is winning basketball games.
Of course, not all teams operate like this, even good, disciplined teams. Which is a bit of an issue. If not all teams use the same substitution patterns, is it really fair to measure a player's effectiveness with a stat that is so reliant on substitution patterns? Surely, there are ways to smooth this out with math, and things tend to normalize and settle over the course of a season, but if your underlying assumptions are a little murky, it gets tougher to trust the stat created from them.
Team strategy also can throw off stats. For example, when Nikola Jokić or Jayson Tatum are in the game, often their team's strategy on the defensive glass is to let those players handle it, because they're really great at defensive rebounding, and can be trusted to grab them. There's also likely an element of implicit stat padding – creating a strategy that lets them get those boards keeps these superstars fat and happy, in a statistical sense. Does that mean that in each game where they pile up 10+ defensive rebounds it was because they were simply better than everyone else at it? That they fought tooth and nail, chopping metaphorical jungle brush away with their metaphorical machete on their quest for each rebound? Or is it reflective of the fact that the team's strategy was to have the other four players release down court to try and get an easy bucket in transition once Jokić or Tatum secured the board? Or both?
Jaylen Brown is actually an instructive example of this. From the start of last season through March 4th, Brown averaged what would have been a career-high 6.1 defensive rebounds and 7.2 total rebounds per game. Then Tatum came back on March 6th, and Brown didn't have to do as much on the glass. For the remainder of the season, he averaged 4.7 defensive rebounds and 6.0 total rebounds per game, which are more in line with his career averages. It's not that Brown – or Aaron Gordon, who has averaged fewer rebounds in Denver than he did in Orlando – are not capable and effective rebounders. It's just that the construction of and strategy employed by their teams is such that the frequency with which they are asked to crash the boards is lower than their ability or capability of doing so.
Baseball statistics simply don't have this problem. Yes, every once in awhile, a hitter will be asked to hit the ball to the right side to move a baserunner along, or lay down a sacrifice bunt – though these type of strategies are implemented less frequently these days – but in 98-99% of the situations, the hitter's goal is the same: don't make an out. The pitcher's goal is the opposite: make an out. In basketball, the goal is to score or not allow the other team to score, but there are a myriad of ways to accomplish that goal, and each player may have vastly different responsibilities in achieving it, even from possession to possession.
This brings us to my final eternal bone to pick with NBA analytics, and that's defensive valuation. When you watch an NBA game, you see that a team spends half of its time playing offense, and half of it playing defense. Yet this is not how a player's contributions are weighted. If you look at the 2025-2026 Win Shares leaderboard, for instance, you'll see offensive prowess is rated as essentially twice as important as defensive prowess:
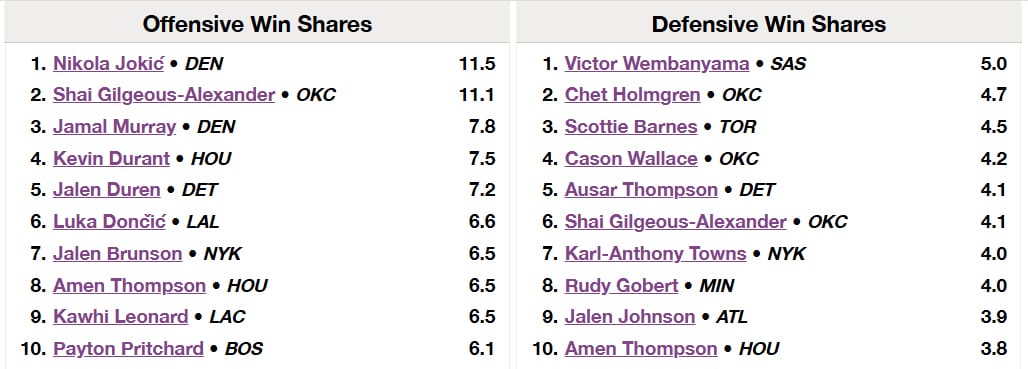
The argument here is that it's twice as hard or nearly twice as hard to score a bucket as it is to defend one. I've never quite agreed with this, and admittedly, this is a personal philosophy, but what it does is punish really great defenders. For instance, last season, Victor Wembanyama finished with 10.0 Win Shares, good for sixth place in the NBA overall. Kevin Durant finished with 10.7, in fourth place overall. With metrics this good, you'd think Durant had an incredible season worthy of MVP votes. In reality, he received not a single vote, while Wembanyama finished third. Perhaps you find this to be an injustice, and that Durant should have been more recognized. Personally, I think it shows how the analytical measurement of offense and defense is out of whack, and that adjustments need to be made.
We could also have a long discussion about building a trusted stat for basketball based off of a baseball stat that was nearly immediately derided as overly complex and not incredibly useful, as was Win Shares. Pick up a copy of Win Shares by Bill James sometime, I dare you (you'll need to find a used copy, it's out of print). Even in my baseball nerd days, as a completist who likes to finish any book I start, I could not finish that book. It's unreadable. Baseball-Reference, in fact, does not even track or display Win Shares on its player pages or site in any way. It essentially no longer exists. So why do we care about a basketball stat based off of it? Not that the issue of overweighting offense over defense is exclusive to Win Shares. The stat Box Plus/Minus does the same thing.
Getting back to the point about who is responsible for what – each team chooses to attack defense in different ways. For starters, there are multiple different constructions. Most commonly, man-to-man vs. zone defense, but within that concept there are nuances and differences, and there are other constructions as well. A team with Rudy Gobert is going to naturally try to funnel action at Gobert, so as to maximize his impact. Does that make Jaden McDaniels or Anthony Edwards less good at defense? Of course not. That is simply the team's strategy. If your team's strategy is to leave corner three-point shooters open in favor of packing the paint, the way Oklahoma City's defense operated this past season, does that mean the team's perimeter defenders were to blame when San Antonio drilled corner three after corner three? I think not – most people can still understand that Cason Wallace, Alex Caruso, Lu Dort, and Shai Gilgeous-Alexander are all still excellent perimeter defenders. And not only does each team have different strategies, but they can shift and morph in real time, because basketball is constant and fluid, and that it makes harder to pin down who is doing what. It is for many of these reasons that defense is measured as less important than offense, but this in turn makes it harder to account for a fully accurate picture of a player's individual worth through analytics alone.
...
Is all of this to say there are no useful basketball analytics? Quite the contrary. I enjoy looking at these stats, and using them to consider what I think I know based on what I see with my own eyes, which is very much the point. I have to restrain myself from subscribing to data sources like Dunks and Threes, because sports analytical writing is no longer my job, and I shouldn't spend too much money on stuff like that. I still subscribe to FanGraphs out of loyalty, and pay $8/month for Stathead, and I barely use that (not to mention several sportswriting newsletters, which tends to add up).
That doesn't mean basketball analytics should be taken as gospel, or allow them to outweigh the eye test and observation. Given the lack of discreet events that basketball produces in relation to baseball, the fact that many advanced stats are a black box and/or have not become the industry standard thanks to a lack of debate in the virtual town square, and the fact that basketball's fluidity requires far more contextualizing than baseball and often even football – where the role of each player is very clearly defined on most plays – it makes it difficult to give analytics the prominence we do in baseball. As Brad Stevens said in his press conference after the Jaylen Brown trade, they are a piece of the puzzle, not the whole puzzle. It's not about who is right and who is wrong – you need both analytics and observation to get a full picture of a player's value in baseball, basketball, and other sports. But the difference is that in baseball, it is much easier to establish an authoritative look at a player's value through advanced statistics alone, and it is for these reasons that I just don't take basketball analytics as seriously.